Modernisation of heating equipment at Slovak Medical University in Bratislava
CAMASE implemented the refurbishment and modernisation of heating equipment with the goal of increasing energy efficiency and optimising heating control in the University’s buildings following its success bid for a public tender to modernise the heating equipment at the Slovak Medical University in Bratislava, announced in 2012.
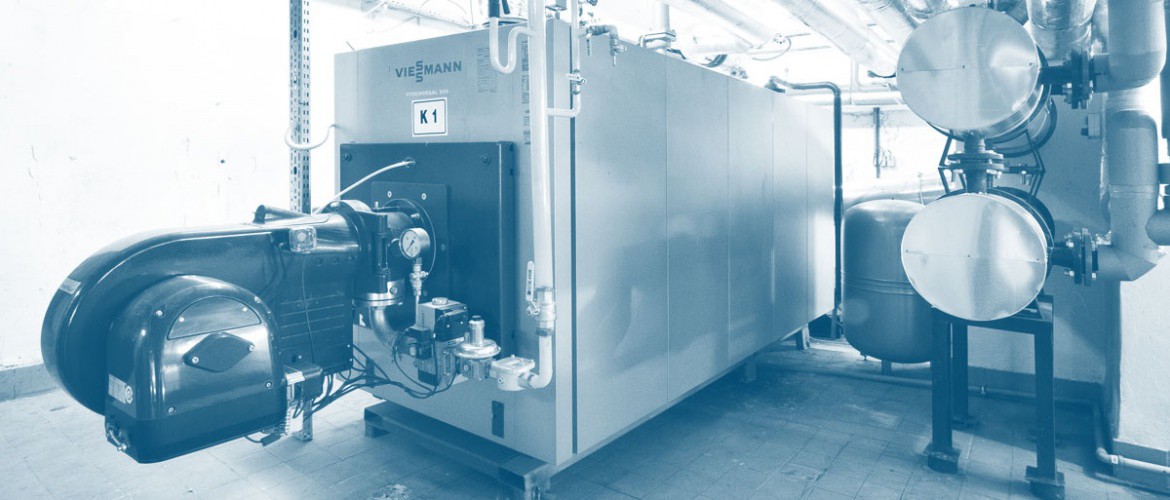
The inefficient existing steam system was replaced with a highly-efficiency hot water cascade-type system with low-pressure condensing boilers to minimise natural gas consumption costs. The distribution system was improved through the use of new circulation pumps, with variable frequency drives providing hydraulic balancing controls in individual circuits while decreasing energy consumption. The overall heat and hot water plant is managed by controls and instrumentation directly in the plant itself, with remote access provided by the CAMASE dispatch centre, which monitors and balances operations for assessment purposes.
CAMASE provided the following scope of services to the Slovak Medical University after successfully completing the refurbishment and modernisation of its heating equipment:
- Comprehensive administration of heat sources
- Maintenance, repairs and operation of the equipment
- Emergency services and technical equipment service
- Specialised inspections and testing of technological equipment, controls and instrumentation
- Energy management
The Slovak Medical University has now completed 3 successful heating seasons
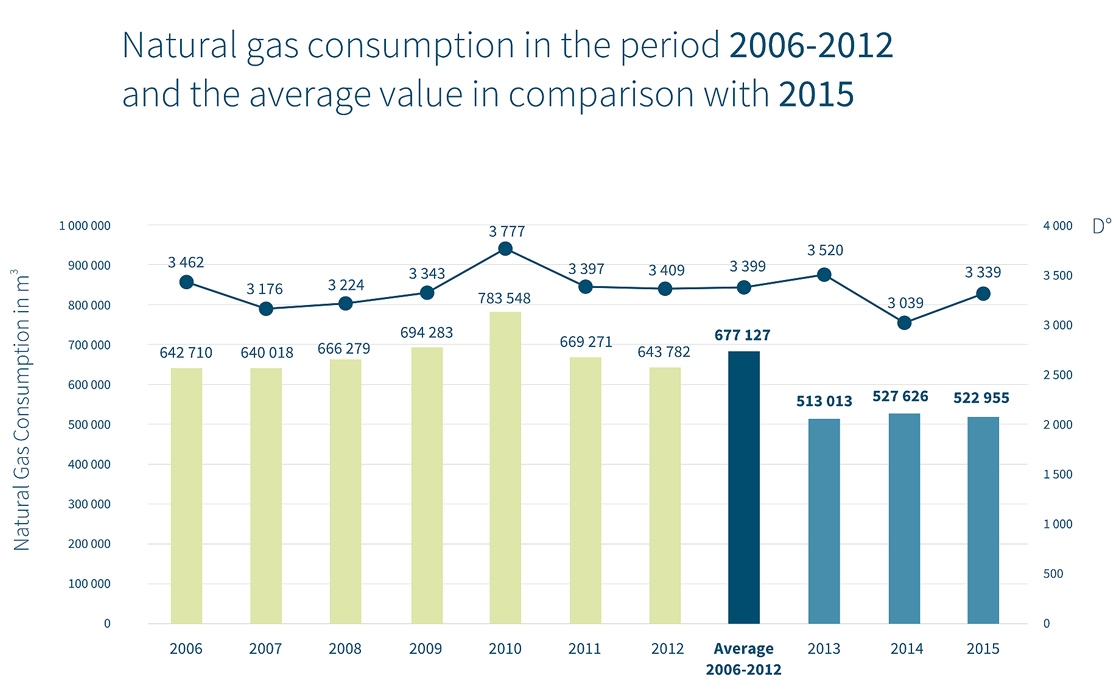
Natural gas savings in 2015 were 22.77% in terms of m3 and 21.88% in terms of kWh, compared to the long-term average of boiler room operations before the modernisation project, with absolute reductions of 154,172 m3 and 1,570,794 kWh of natural gas for the year.
The table below provides an overview of natural gas consumption from 2006 to 2015 and average consumption from 2006 to 2012 (expressed in m3 and kWh). This average is compared to 2015, when the third year of the period of guaranteed heat plant operational savings started after the modernisation of the boiler room.
| SZU | January | February | March | April | May | June | July | August | September | October | November | December | ||||
|---|---|---|---|---|---|---|---|---|---|---|---|---|---|---|---|---|
| AVERAGE | m3 | 118 736 | 103 050 | 84 039 | 40 105 | 18 982 | 16 872 | 15 172 | 13 802 | 20 192 | 58 000 | 83 345 | 104 832 | 677 127 | Savings | |
| 2006 - 2012 | kWh | 1 257 360 | 1 091 370 | 889 646 | 424 722 | 200 999 | 178 833 | 160 828 | 146 448 | 214 156 | 614 662 | 882 650 | 1 110 550 | 7 179 998 | ||
| 2013 | m3 | 96 325 | 72 805 | 71 939 | 30 891 | 12 919 | 14 533 | 7 9988 | 8 041 | 10 120 | 44 345 | 62 606 | 80 491 | 513 013 | 164 114 | 24,24% |
| kWh | 1 026 455 | 775 359 | 764 882 | 328 797 | 138 656 | 156 486 | 85 862 | 86 209 | 107 815 | 471 887 | 667 687 | 858 525 | 5 468 617 | 1 711 381 | 23,84% | |
| 2014 | m3 | 89 441 | 73 135 | 55 563 | 41 241 | 34 701 | 14 259 | 9 048 | 10 139 | 13 718 | 40 815 | 61 680 | 83 886 | 527 626 | 149 501 | 22,08% |
| kWh | 955 205 | 780 335 | 594 155 | 442 262 | 372 774 | 153 239 | 97 560 | 109 759 | 147 472 | 437 078 | 660 299 | 898 996 | 5 649 135 | 1 530 863 | 22,77% | |
| 2015 | m3 | 97 456 | 88 410 | 74 104 | 36 859 | 13 617 | 5 824 | 3 833 | 3 690 | 7 978 | 52 665 | 58 295 | 80 224 | 522 955 | 154 172 | 22,77% |
| kWh | 1 042 752 | 945 584 | 793 513 | 395 294 | 147 414 | 63 524 | 41 726 | 40 114 | 86 442 | 567 518 | 625 564 | 859 761 | 5 609 204 | 1 570 794 | 21,88% | |

